Table of Contents
Astrophysical laboratory course: Observations
Observations within the scope of lab course for master students: Depending on the weather conditions, the experiments S1, S2, N1, and N2 are scheduled. Both the observations and the data reduction of S1 and S2 are done together. For each night observation (N1 and N2) a protocol is required, see the prepared form: observation protocol. It is strongly suggested to prepare a list with possible objects for each observation! The following form might be helpful: object list.
Solar Observation
S1 - Solar Rotation
The sun will be observed during an excursion to the Einsteinturm (Einstein Tower) at the Telegrafenberg in Potsdam, The Einsteinturm is a tower telescope, consisting of a coelostat, a lens with a diameter of 60 centimetre, and a spectrograph that is 14 metre long. The data will be reduced with various software tools. Using the Doppler shift of solar spectral lines at the edge of the solar disk one can calculate the rotational period of the Sun.
S2 - Estimating the magnetic field strength of a sunspot
Another observation of the sun at the Einsteinturm will focus on a sunspot. The slit of the spectrograph will be placed on the position of a sunspot to take the spectrum there. From the Zeeman-splitting of the spectral lines one can calculate the magnetic field strength of the sunspot.
Instructions: Estimating the Magnetic Field Strength of a Sunspot
Night observations
N1 - Stellar spectra of different spectral types
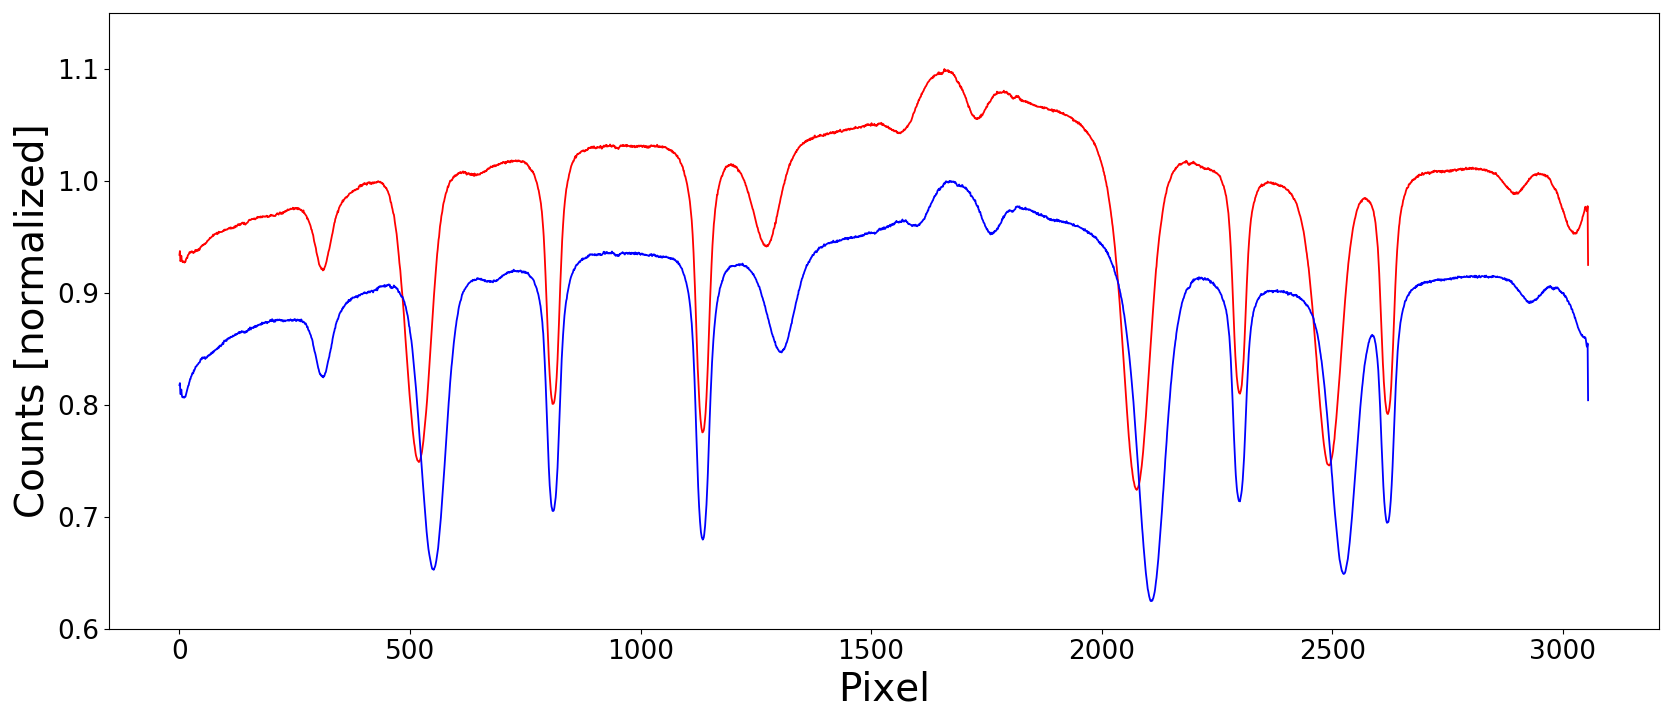
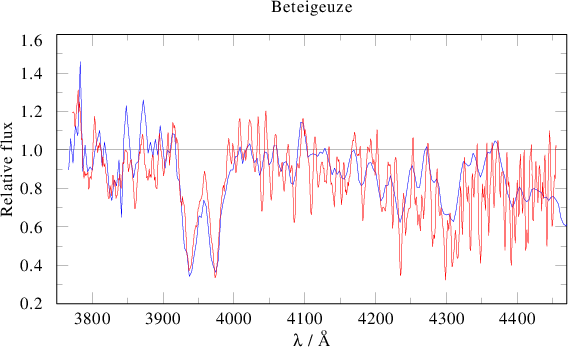
The aim of this observation is to identify the spectral types of several stars using their spectral properties and to derive their radial velocities. We provide a spectral atlas of all spectral classes that can be used to identify the spectral class and a linelist of important lines. For this purpose either a normal slit spectrograph (DADOS) or a powerful echelle spectrograph (BACHES) will be used in combination with a cooled CCD camera. We will provide a list of currently visible stars of different spectral classes on the night of the observation, which will be observed and classified. The spectra are reduced and calibrated with provided scripts.
BACHES spectrograph
Instructions: Stellar spectra of different spectral types (BACHES)
DADOS spectrograph
Instructions: Stellar spectra of different spectral types (DADOS)
N2 - Photometry of open star clusters
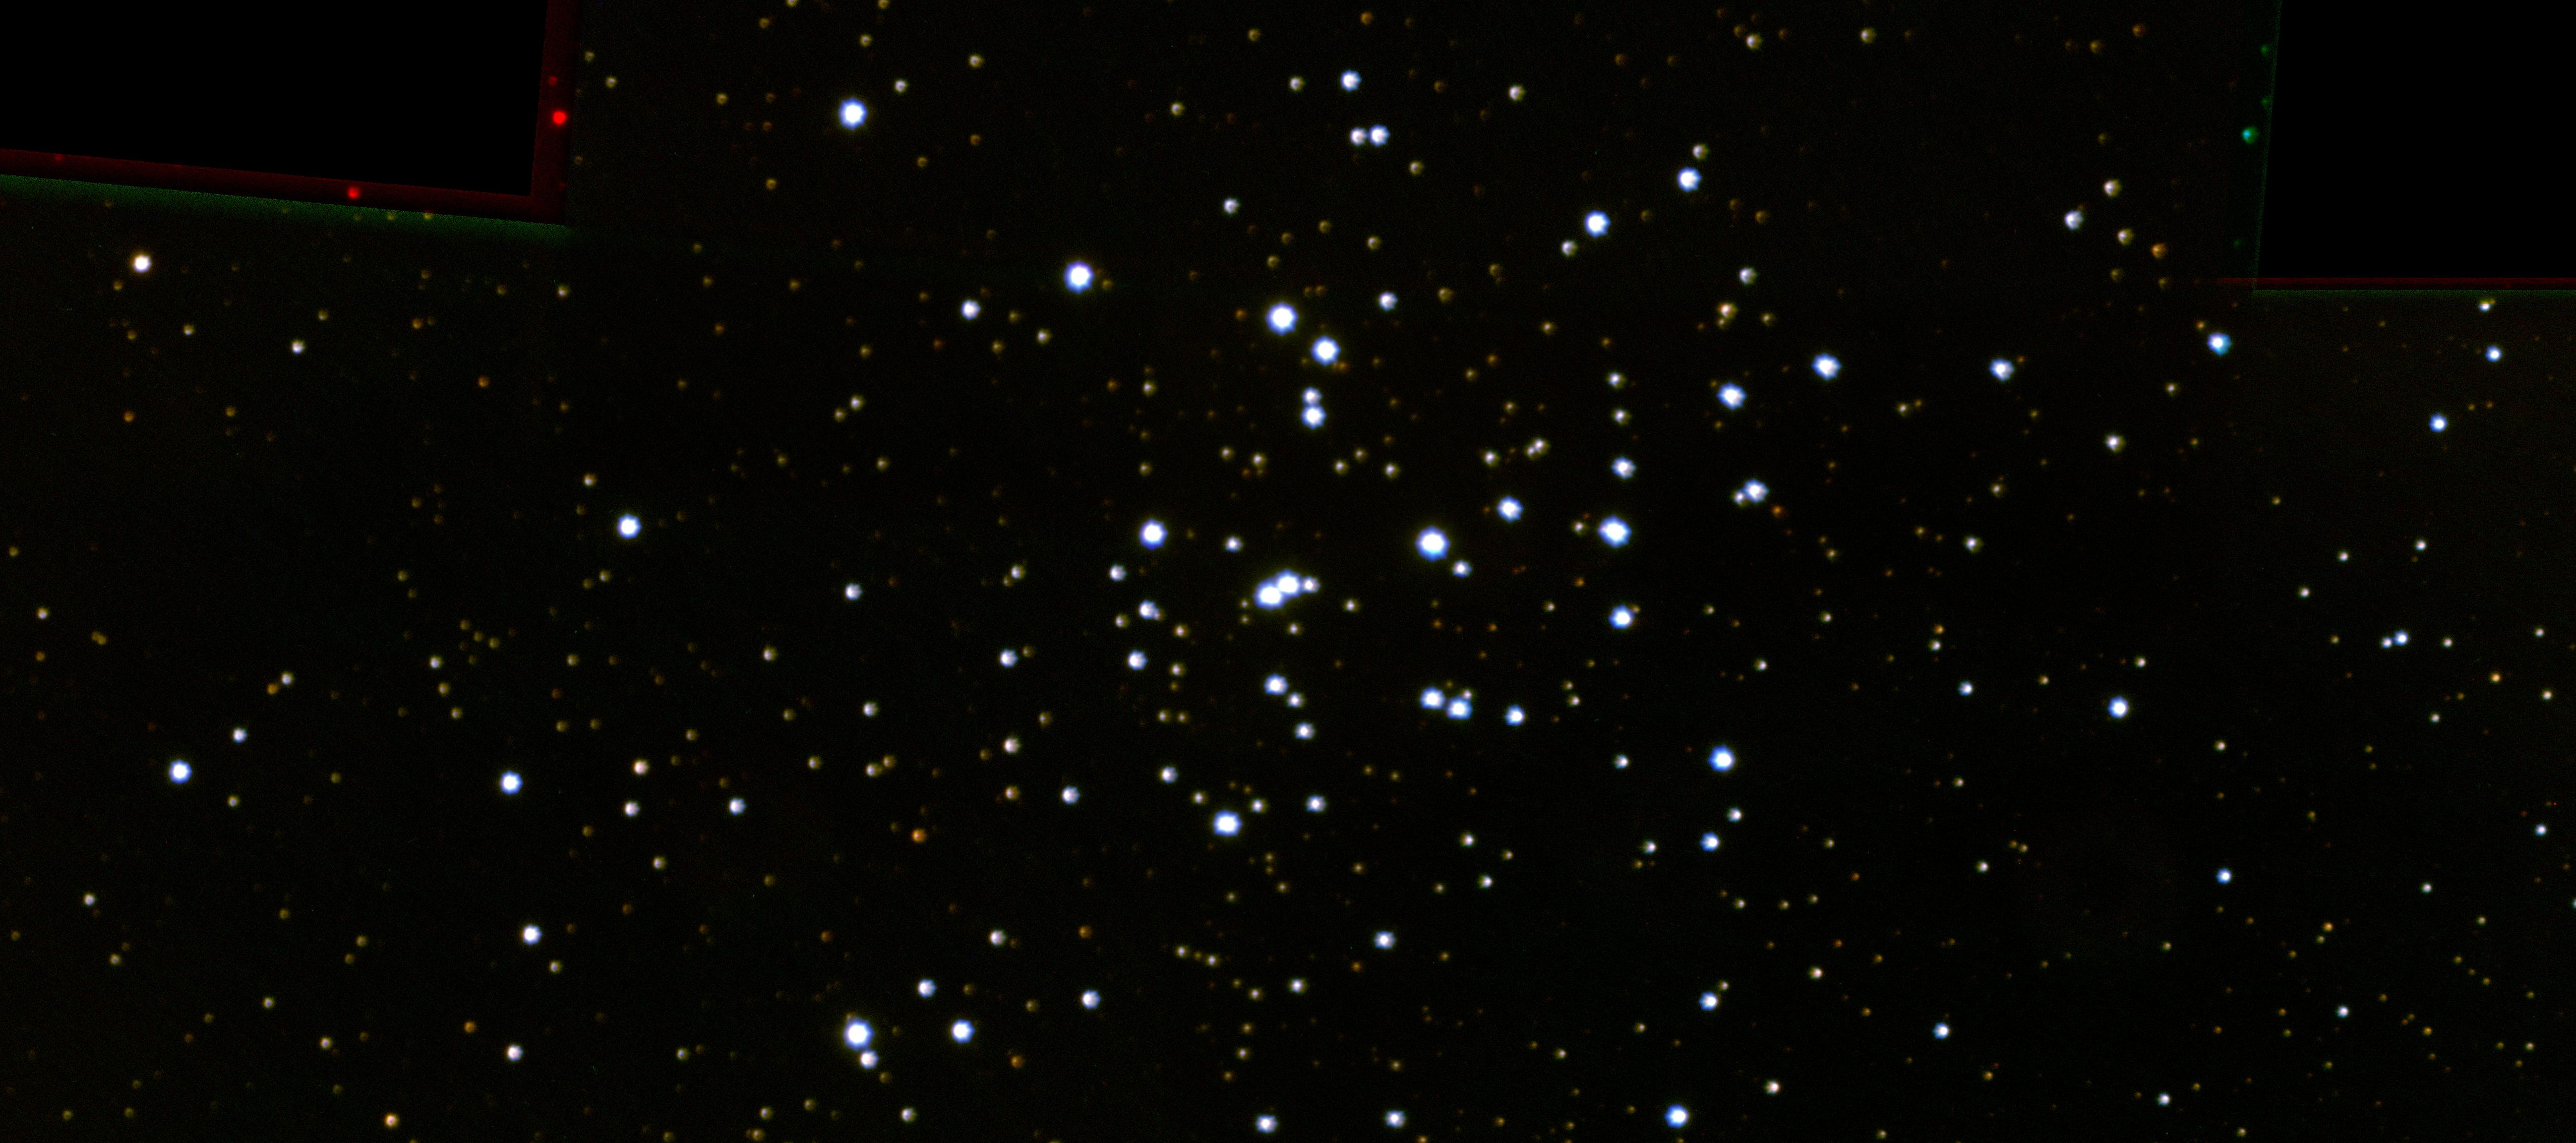
During the accompanying seminar several talks on CCDs, photometry, and the data reduction will give an introduction to this observation. The observations will be carried out either at the OST or at the 25.5“ (70cm) reflecting telescope at the observatory of the AIP (Leibniz-Institut für Astrophysik Potsdam) in Babelsberg. Images of the open clusters as well as the necessary calibration data will be taken in different filters with a cooled CCD camera. The data will be reduced and evaluated using provided and self-written software. At the end a colour-magnitude diagram shall be constructed for each open cluster, from which e.g. the age of the cluster can then be estimated.
Data analysis at the computer
D1 - Interstellar medium
Interstellar matter can be seen in the spectra of luminous objects. If, for example, the light of a background star crosses an interstellar gas cloud, the stellar spectrum will show additional absorption lines. In this experiment these interstellar lines will be identified and evaluated at the computer to construct a growth curve and to draw conclusions on the element abundances in the cloud.
D2 - Mass loss of OB-type stars
Massive stars have a strong mass loss because of their powerful stellar winds. The spectra of these objects are characterized by P-Cygni lines (a blueshifted absorption in combination with a redshifted emission) or even (pure) emission lines. In the seminar the method to determine the mass loss rate from radio emissions are presented in detail. In this experiment the obtained formula will be applied to real measurements to calculate mass-loss rates of typical OB-type stars. These necessary data can be obtained from online databases.
D3 - Spectral analysis of a Wolf-Rayet star
Wolf-Rayet stars are a special case of massive stars, representing a late phase in their evolution. The spectra of these objects are (completely) dominated by emission lines that are formed in their exceptionally strong stellar winds. To obtain the stellar parameters of these stars their observed spectra are compared with model spectra. The Potsdam Wolf-Rayet (PoWR) model atmospheres can especially be used to analyze Wolf-Rayet stars. In this laboratory experiment a short introduction to the work with PoWR spectra is given with the goal of determining the parameters of a Wolf-Rayet star.


